1. Dynamic Support and Resistance Levels
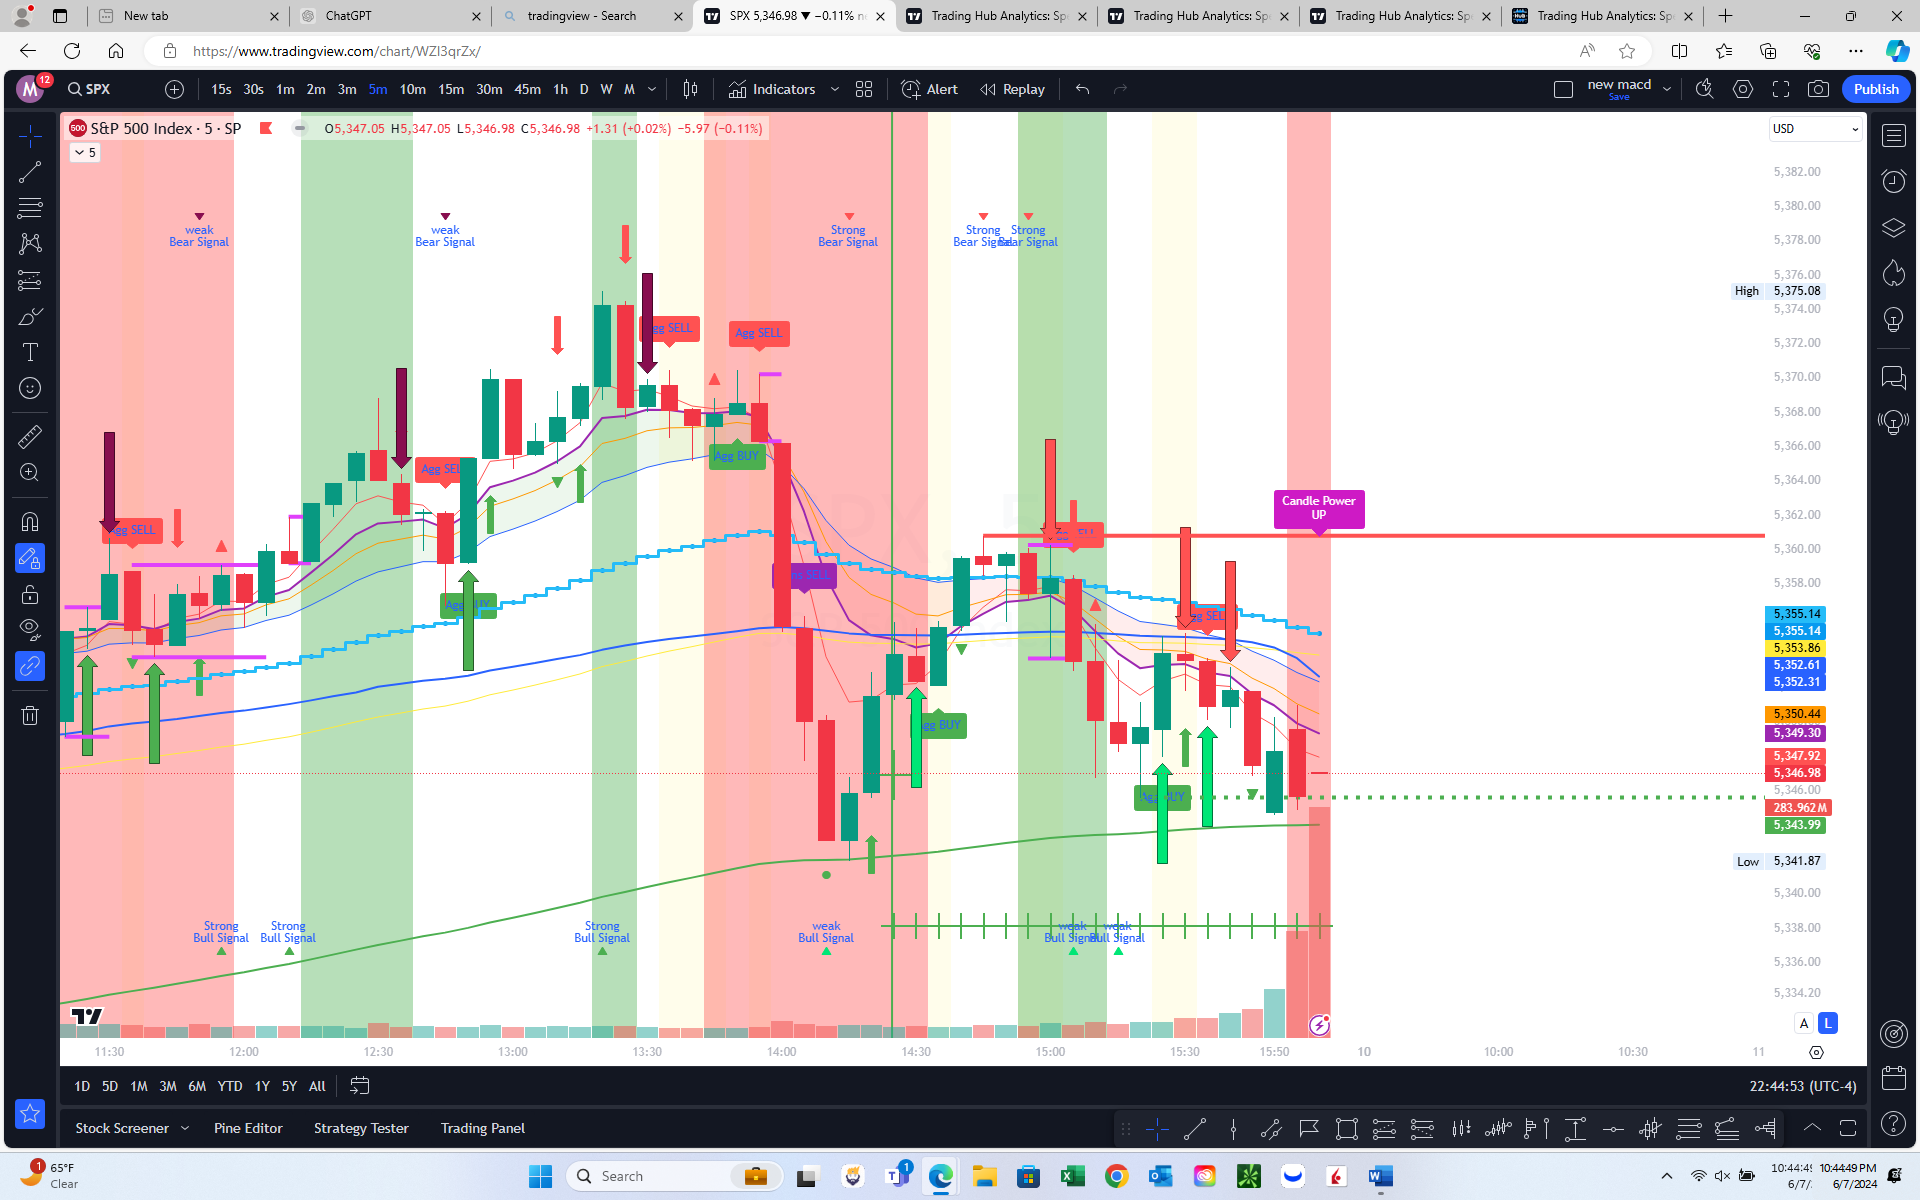
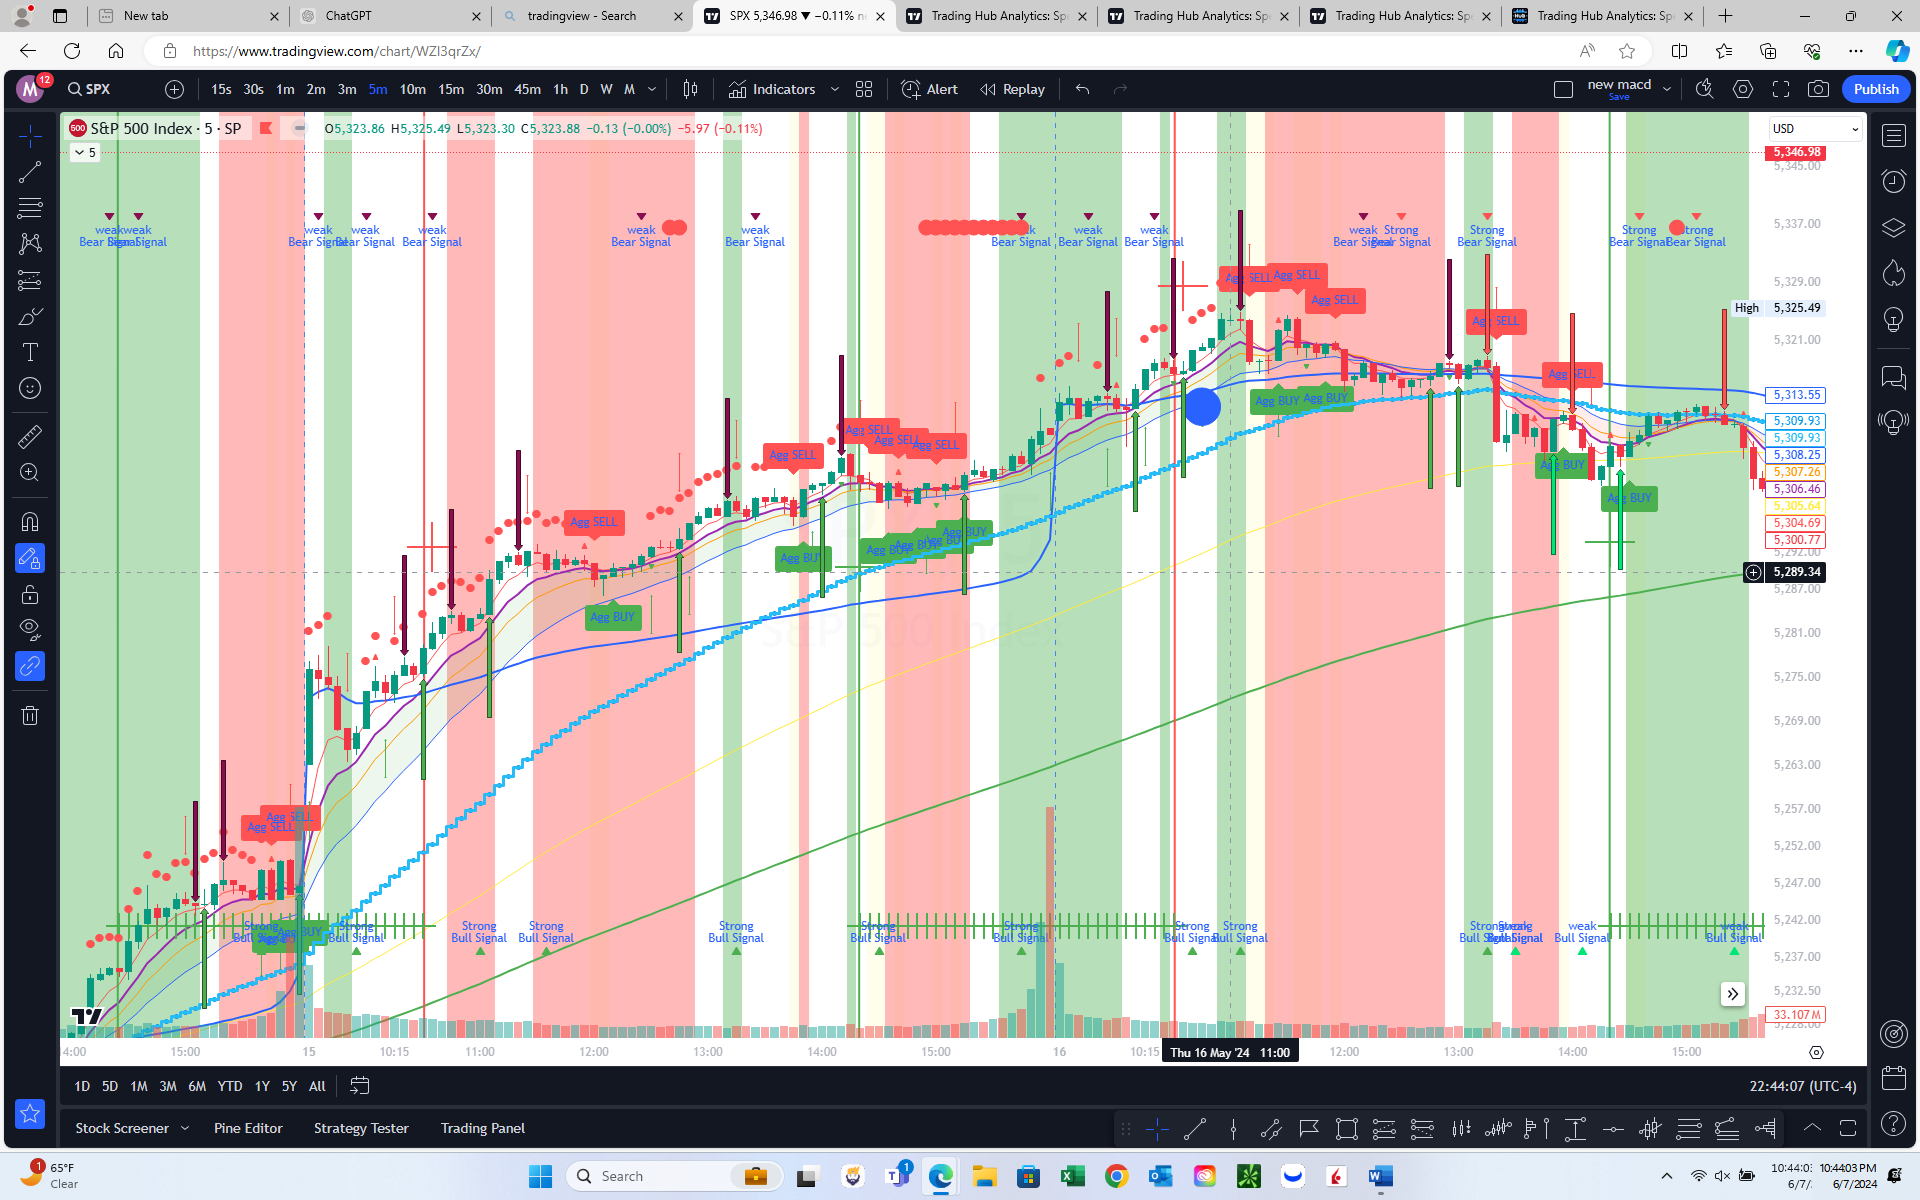
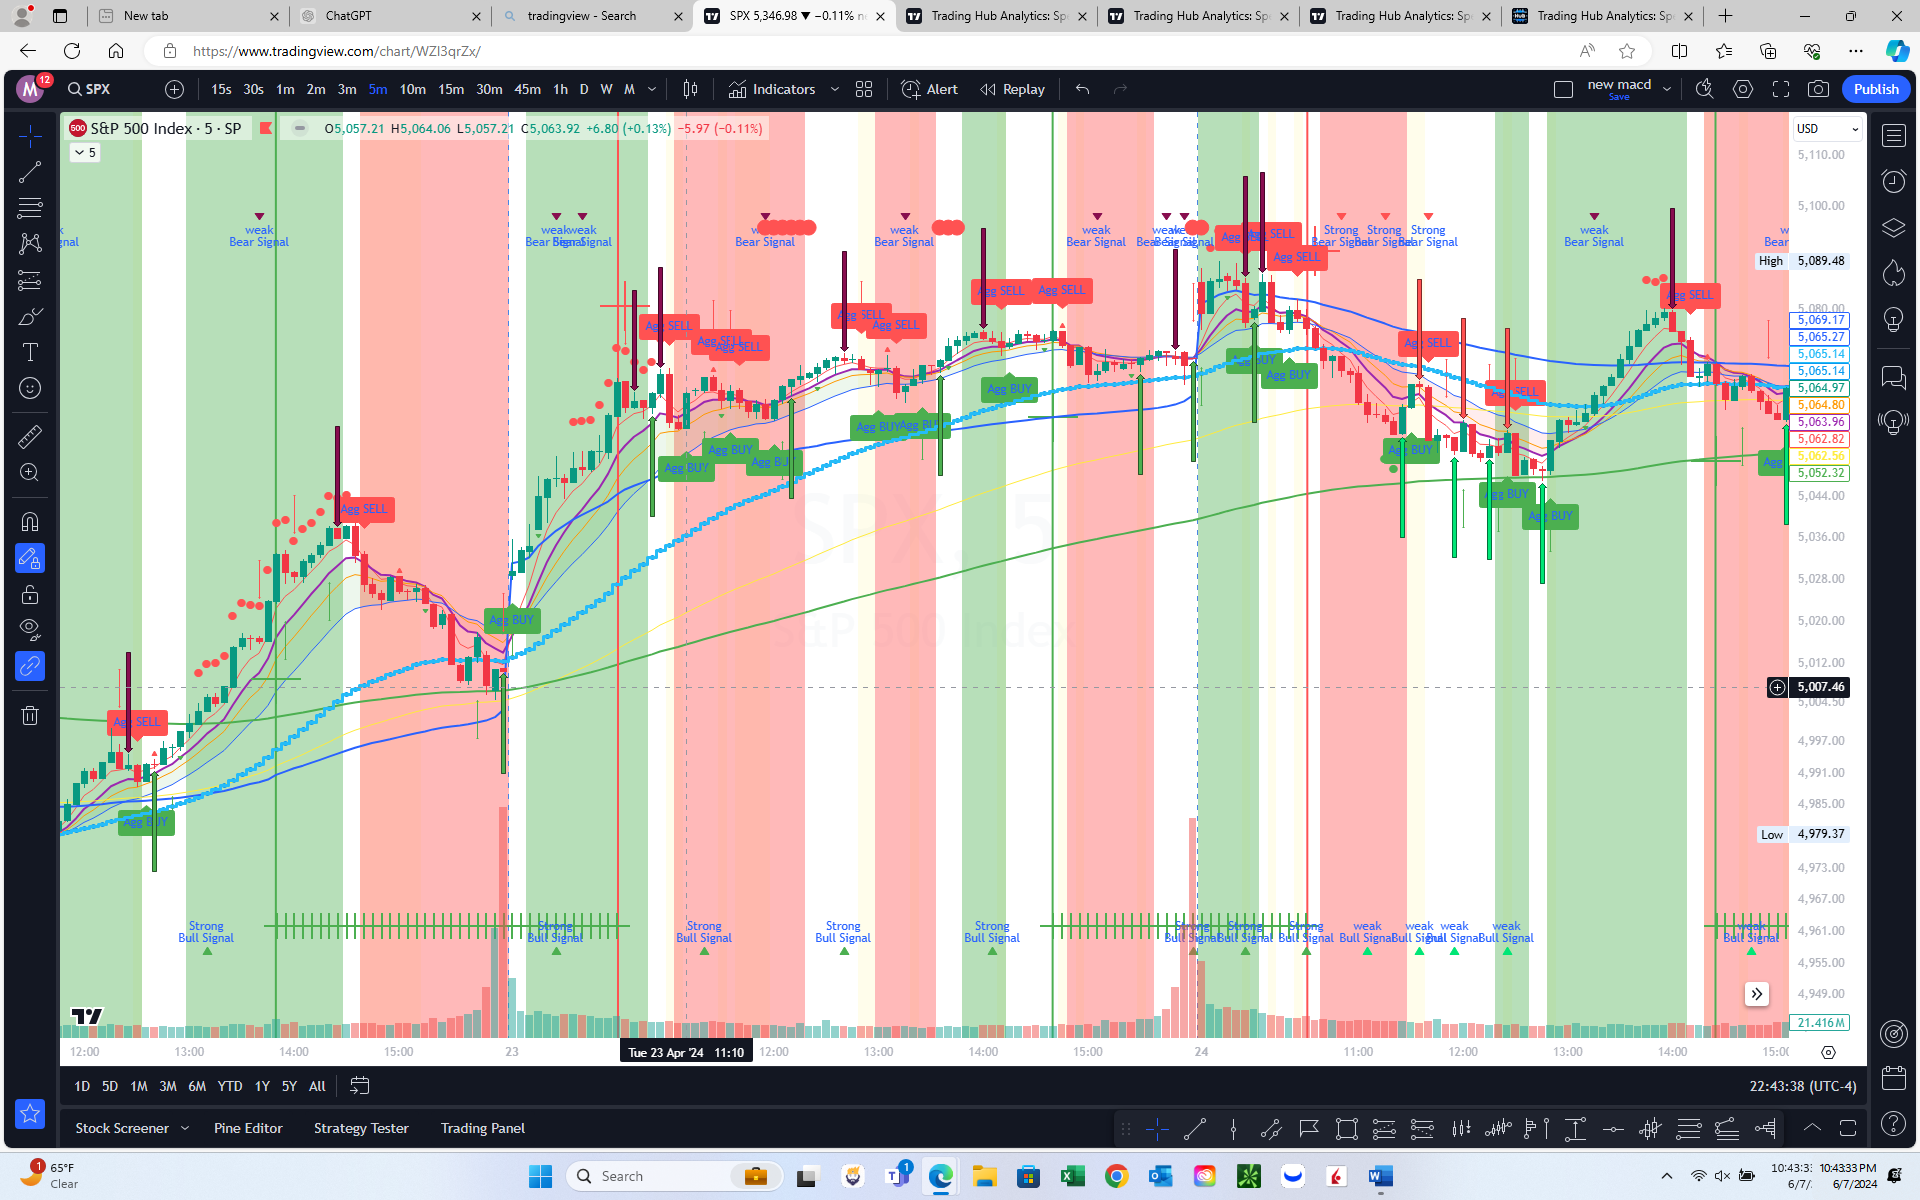
- Multiple Indicators: Utilizes various indicators to identify dynamic support and resistance areas, which are plotted in the chart in various colors, helping traders understand potential price reversal points.
2. SPX Daily Move Analysis
- Move Tolerance Levels: Highlights moderate and extreme moves in the SPX, providing insights into market volatility and potential trend changes.
- Range Thresholds: Analyzes daily price ranges to identify periods of consolidation or breakout potential.
3. Volume Oscillator
- Momentum Confirmation: Calculates and plots a volume oscillator to confirm trends or detect divergences between volume trends and price movements, signaling potential reversal points or trend continuation.
4. RSI-Based Overbought/Oversold Signals
- Visual Indicators: Places red dots on candles in overbought areas and green dots in oversold areas using the Relative Strength Index (RSI), making these conditions easily identifiable.
5. Consolidation Detection
- Range Highlighting: Identifies and highlights periods of consolidation using proximity and angle calculations of key indicators. During these periods, it plots support and resistance levels, making it easier to spot potential breakouts from the consolidation.
6. VWAP and Standard Deviation Bands
- Volatility Measurement: Plots Volume Weighted Average Price (VWAP) along with upper and lower bands based on standard deviation, helping traders identify overbought or oversold conditions relative to the VWAP.
7. Aggressive and Conservative Buy/Sell Signals
- Flexible Signal Generation: Generates buy and sell signals based on price action and indicator crossovers, with user options to include or exclude signals during consolidation periods.
8. Squeeze Detection
- Potential Breakout Indicator: Monitors the convergence of multiple indicators to identify potential squeeze conditions, signaling a likely breakout in either direction.
9. Recent Support and Resistance Identification
- Swing Points: Detects recent swing highs and lows, plotting them as potential support and resistance levels.
10. MACD and StochRSI Analysis
- Direction Changes and Crossovers: Uses Moving Average Convergence Divergence (MACD) and Stochastic RSI to detect and signal potential market reversals and trend continuations.
- Strength Classification: Differentiates between strong and weak bullish/bearish signals based on MACD crossovers and histogram analysis.
Benefits for Traders
- Enhanced Decision Making: Provides comprehensive technical analysis tools to identify key support and resistance levels, trend directions, and potential reversal points.
- Visual Cues: Utilizes colors, dots, and labels to make complex data easily interpretable, helping traders quickly assess market conditions.
- Volatility Insights: Analyzes market volatility and consolidation, aiding in the identification of breakout opportunities and risk management.
- Customizable Alerts: Allows for personalized settings to tailor the analysis to individual trading strategies and preferences.
- Momentum Confirmation: Confirms trends with volume and momentum indicators, enhancing the reliability of trading signals.


