THADI: Spectrum Higher High Lower Low Strategy Pro+ Suite 1.0
Trading Hub Analytics: Spectrum Higher High Lower Low Strategy Pro+ Suite 1.0 - User Manual
Introduction
The "Spectrum Higher High Lower Low Strategy Pro+ Suite 1.0" is a comprehensive trading script designed for identifying and visualizing market trends based on higher highs, lower lows, and significant support and resistance levels. This guide will provide instructions on how to configure and utilize the script for your trading needs.
Key Features
-
Trend Detection:
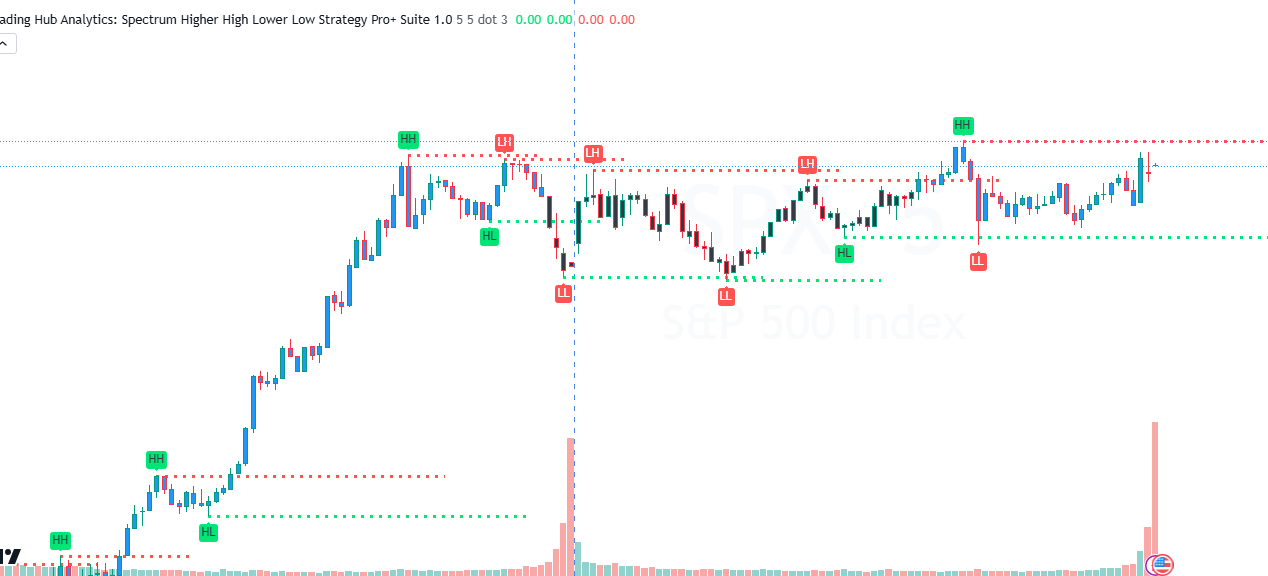
- Identifies higher highs (HH), lower lows (LL), higher lows (HL), and lower highs (LH).
- Plots labels on the chart to signify these points.
-
Support and Resistance Lines:
- Automatically draws support and resistance lines based on the identified points.
- Provides visual cues for potential trend reversals or continuation.
-
Dynamic Trend Indicator:
- Changes bar colors to indicate current trend direction (uptrend or downtrend).
-
Customizable Settings:
- Allows users to adjust the lookback period, bar colors, line styles, and more.
User Settings
1. General Settings:
- Left Bars (lb): Number of bars to the left of the pivot point.
- Right Bars (rb): Number of bars to the right of the pivot point.
- Support/Resistance (showsupres): Toggle to show/hide support and resistance lines.
- Line Style/Width (srlinestyle, srlinewidth): Customize the appearance of support and resistance lines.
- Change Bar Color (changebarcol): Toggle to change bar colors based on trend direction.
- Bar Color Up (bcolup): Color for uptrend bars.
- Bar Color Down (bcoldn): Color for downtrend bars.
2. Color Settings:
- Support Color (supcol): Color for support lines.
- Resistance Color (rescol): Color for resistance lines.
Using the Script
-
Configuring Inputs:
- Open the settings panel and set your desired input values.
- Adjust the lookback periods (
lbandrb) to fine-tune pivot point detection. - Enable or disable support and resistance lines as needed.
-
Trend Analysis:
- Observe the chart for labels indicating Higher Highs (HH), Lower Lows (LL), Higher Lows (HL), and Lower Highs (LH).
- These labels provide insight into potential trend direction and strength.
-
Support and Resistance:
- Look for automatically drawn support (green lines) and resistance (red lines) levels.
- Use these levels to identify potential entry and exit points.
-
Dynamic Bar Coloring:
- Bars will change color based on the detected trend: blue for uptrend and black for downtrend.
- This visual cue helps quickly identify the current market sentiment.
Example Usage
-
Identifying Trend Reversals:
- If a Higher Low (HL) is followed by a Higher High (HH), this could indicate the start of an uptrend.
- Conversely, if a Lower High (LH) is followed by a Lower Low (LL), this may signal a downtrend.
-
Using Support and Resistance:
- Support lines (green) can act as potential buy zones or areas to set stop-loss orders.
- Resistance lines (red) can be used to identify potential sell zones or take-profit levels.
-
Dynamic Bar Coloring:
- During an uptrend, bars will be colored blue, providing a clear visual indication of market strength.
- In a downtrend, bars will turn black, signaling market weakness.
Interpretation Tips
-
Higher Highs and Higher Lows:
- Indicate an uptrend. Look for buy opportunities when these points are identified.
-
Lower Lows and Lower Highs:
- Suggest a downtrend. Consider sell opportunities when these points are detected.
-
Support and Resistance Levels:
- Use these levels to plan entries, exits, and manage risk effectively.
-
Dynamic Trend Indicator:
- Utilize the bar color changes to stay aligned with the current market trend.
By following this user manual, traders can effectively leverage the "Spectrum Higher High Lower Low Strategy Pro+ Suite 1.0" to enhance their trading strategies and make informed decisions based on comprehensive technical analysis.
