Data Intelligence for Trading, Advanced Insights, and Custom Indicators—Plus Personal Finance Insights
Search
-
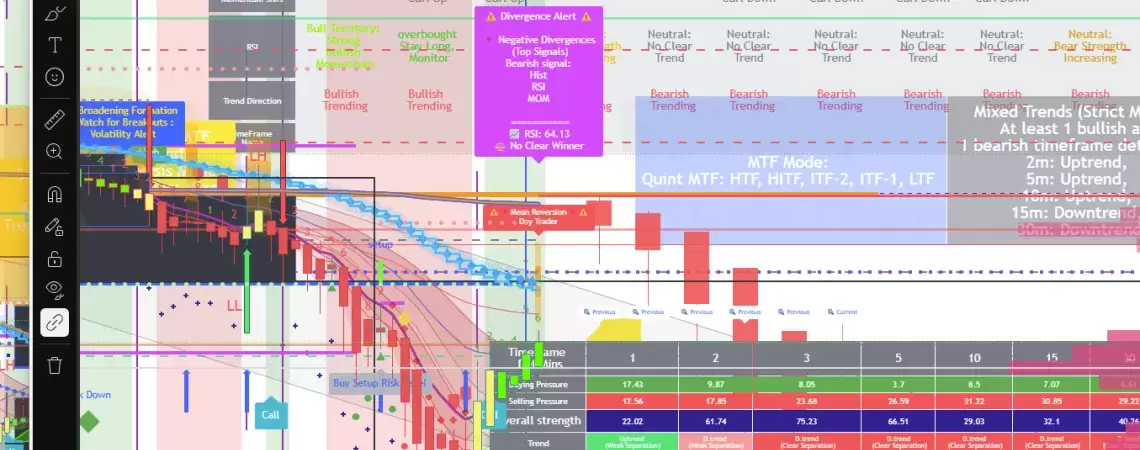
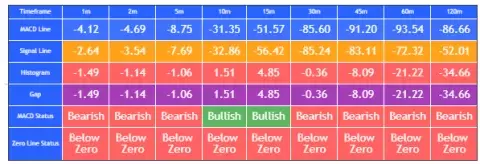
A day trading algorithm built to sync with market momentum using multi-frame trend (MFT) analysis. This cutting-edge system delivers real-time Buy and Sell signals directly on your chart.
Posts Carousel (Featured)
Square Posts Carousel
Featured Video
Latest Videos
Image block (Static)
Posts Masonry
-
by a a
-
by a a
-
by M L
-
by M L
-
by M L
-
by a a
-
by M L
-
by M L
-
by M L
-
by M L
-
by a a
-
by M L
-
by M L
-
by F V
-
by a a
-
by M L
-
by a a
-
by M L
-
by M L
-
by a a
-
by a a
-
by M L
-
by F V
-
by M L
-
by M L
-
by a a
-
by M L
-
by a a
-
by F V
-
by a a
-
by M L
-
by M L
-
by M L
-
by M L
-
by M L
 by a a
-
by a a
-
by F V
-
by a a
-
by M L
Personal Finance Insights Hub & Dashboard
| Financial Independence & Early Retirement (FIRE) |
| Introduction to FIRE |
| Strategies for Early Retirement |
| High-Savings and Low-Expense Lifestyles |
| Sustainable Withdrawal Rates and Planning |
| Budgeting & Saving |
| Budgeting Basics |
| Budgeting Tools |
| Seasonal Budget Adjustments |
| Budgeting for Life Changes |
| Saving Strategies |
| Savings Accounts |
| Credit & Loans |
| Credit Card Management |
| Credit Cards |
| Understanding Debt |
| Debt Repayment |
| Estate Planning |
| Legacy and Family Protection |
| Essential Documents |
| Beneficiary Management |
| Family Planning & Financial Literacy |
| Planning for Children’s Education |
| Family Budgeting Tips |
| Introducing Kids to Financial Literacy |
| Estate Planning for Families |
| Financial Planning |
| Financial Mindset |
| Financial Tools |
| Calculators |
| Budgeting Apps |
| Investment Platforms |
| Financial Automation Options |
| Financial Wellness |
| Building Lasting Habits |
| Professional Guidance |
| Monitoring Progress |
| Learning Resources |
| Income & Career Growth |
| Salary Negotiation |
| Side Hustles and Freelance Income |
| Income Diversification |
| Professional Development Resources |
| Insurance & Risk Management |
| Life Insurance |
| Health Insurance |
| Disability Insurance |
| Homeowners & Renters Insurance |
| Investing |
| Investing Basics |
| Types of Investment Accounts |
| Common Investment Vehicles |
| Investment Strategies |
| Tax-Efficient Investing |
| Money Management |
| Financial Literacy |
| Retirement |
| Retirement Planning Basics |
| Understanding Retirement Accounts |
| Retirement Planning Strategies |
| Common Retirement Mistakes |
| Taxes |
| Tax Planning Basics |
| Maximizing Deductions & Credits |
| Filing Taxes |
Subscribe
Cryptocurrency Market
Key Watchlist Hub
|
| AMZN | AMAZON.COM, INC. (XNAS:AMZN) |
| TSLA | TESLA, INC. (XNAS:TSLA) |
| HD | THE HOME DEPOT, INC. (XNYS:HD) |
| MCD | MCDONALD'S CORPORATION (XNYS:MCD) |
| SBUX | STARBUCKS CORPORATION (XNAS:SBUX) |
| NKE | NIKE, INC. (XNYS:NKE) |
| NIO | NIO INC. (XNYS:NIO) |
| BABA | Alibaba Group Holding Limited (XNYS:BABA) |
| F | FORD MOTOR COMPANY (XNYS:F) |
| SNAP | SNAP INC. (XNYS:SNAP) |
| abnb | AIRBNB, INC. (XNAS:ABNB) |
| jd | JD.COM, INC. (XNAS:JD) |
| lcid | LUCID GROUP, INC. (XNAS:LCID) |
| lulu | LULULEMON ATHLETICA INC. (XNAS:LULU) |
|
| XOM | EXXON MOBIL CORPORATION (XNYS:XOM) |
| CVX | CHEVRON CORPORATION (XNYS:CVX) |
| COP | CONOCOPHILLIPS (XNYS:COP) |
| XLE | Sel Sector:Energy SPDR (ARCX:XLE) |
| V | VISA INC. (XNYS:V) |
| MA | MASTERCARD INCORPORATED. (XNYS:MA) |
| PYPL | PAYPAL HOLDINGS, INC. (XNAS:PYPL) |
| JPM | JPMORGAN CHASE & CO. (XNYS:JPM) |
| BAC | BANK OF AMERICA CORPORATION (XNYS:BAC) |
| WFC | WELLS FARGO & COMPANY (XNYS:WFC) |
| BRK/B | BERKSHIRE HATHAWAY INC. (XSWX:BRK/B) |
| GS | THE GOLDMAN SACHS GROUP, INC. (XNYS:GS) |
| PGR | THE PROGRESSIVE CORPORATION (XNYS:PGR) |
| AXP | AMERICAN EXPRESS COMPANY (XNYS:AXP) |
| C | CITIGROUP INC. (XNYS:C) |
| amtd | AMTD IDEA Group (XNYS:AMTD) |
| PFE | PFIZER INC. (XNYS:PFE) |
| MRK | MERCK & CO., INC. (XNYS:MRK) |
| BMY | BRISTOL-MYERS SQUIBB COMPANY (XNYS:BMY) |
| ABBV | ABBVIE INC. (XNYS:ABBV) |
| UNH | UNITEDHEALTH GROUP INCORPORATED (XNYS:UNH) |
| CVS | CVS HEALTH CORPORATION (XNYS:CVS) |
| gild | GILEAD SCIENCES, INC. (XNAS:GILD) |
| JNJ | JOHNSON & JOHNSON (XNYS:JNJ) |
| GE | GENERAL ELECTRIC COMPANY (XNYS:GE) |
| BA | Alibaba Group Holding Limited (XNYS:BABA) |
| GD | GENERAL DYNAMICS CORPORATION (XNYS:GD) |
| DE | DEERE & COMPANY (XNYS:DE) |
| UNP | UNION PACIFIC CORPORATION (XNYS:UNP) |
| UPS | UNITED PARCEL SERVICE, INC. (XNYS:UPS) |
| ADP | AUTOMATIC DATA PROCESSING, INC. (XNAS:ADP) |
| O | REALTY INCOME CORPORATION (XNYS:O) |
| MSFT | MICROSOFT CORPORATION (XNAS:MSFT) |
| AAPL | APPLE INC. (XNAS:AAPL) |
| ORCL | ORACLE CORPORATION (XNYS:ORCL) |
| nvda | Indiva Limited (XTSX:NDVA) |
| AVGO | Broadcom Inc. (XNAS:AVGO) |
| CSCO | CISCO SYSTEMS, INC. (XNAS:CSCO) |
| INTC | INTEL CORPORATION (XNAS:INTC) |
| AMD | ADVANCED MICRO DEVICES, INC. (XNAS:AMD) |
| MU | MICRON TECHNOLOGY, INC. (XNAS:MU) |
| IBM | INTERNATIONAL BUSINESS MACHINES CORPORATION (XNYS:IBM) |
| CRM | SALESFORCE, INC. (XNYS:CRM) |
| QCOM | QUALCOMM INCORPORATED (XNAS:QCOM) |
| mrvl | MARVELL TECHNOLOGY, INC (XNAS:MRVL) |
| intc | INTEL CORPORATION (XNAS:INTC) |
| txn | TEXAS INSTRUMENTS INCORPORATED (XNAS:TXN) |
| crwd | CROWDSTRIKE HOLDINGS, INC. (XNAS:CRWD) |
| adbe | ADOBE INC. (XNAS:ADBE) |
| COIN | COINBASE GLOBAL, INC. (XNAS:COIN) |
| NEE | NEXTERA ENERGY, INC. (XNYS:NEE) |
| SO | THE SOUTHERN COMPANY (XNYS:SO) |