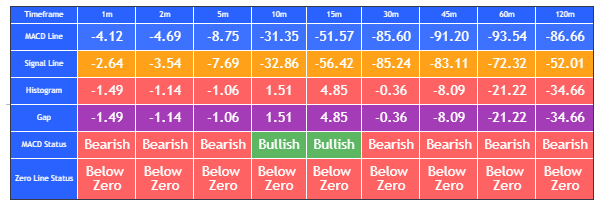
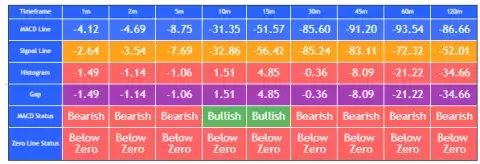
A Guide to Mixed Bullish and Bearish Signals Across Different Timeframes
Interpreting a Mixed MACD Signal Table Across Different Timeframes
Understanding how to interpret a MACD signal table where shorter timeframes show bullish signals while longer timeframes show bearish signals (or vice versa) can provide valuable insights into market dynamics and potential trading strategies. Here's a detailed explanation of how to interpret such scenarios:
Scenario 1: Shorter Timeframes Bullish, Longer Timeframes Bearish
Interpretation
- Shorter Timeframes (Bullish):
- Indicates short-term upward momentum.
- Possible reasons could include a short-term rally or a bounce within a longer-term downtrend.
- Longer Timeframes (Bearish):
- Suggests that the overall trend remains downward.
- The market might be in a correction phase within a larger downtrend.
Trading Strategies
-
Scalping and Short-term Trades:
- Entry: Enter long positions based on bullish signals in shorter timeframes.
- Exit: Exit quickly as the trade is against the longer-term trend. Use tight stop-losses and take profits swiftly.
- Example: Buy on bullish crossover in the 1m or 5m chart, but be prepared to exit if the trade doesn't quickly move in your favor.
-
Swing Trading:
- Entry: Consider the bullish signals in shorter timeframes as opportunities for short-term swings.
- Exit: Plan to exit when the shorter timeframes start to align with the longer bearish trend again.
- Example: If the 15m timeframe shows a bullish crossover, ride the swing but monitor closely for signs of reversal as indicated by the 60m or 120m charts.
-
Confirming Trend Reversal:
- Watch for Confirmation: Before committing to long-term trades, wait for longer timeframes to confirm a reversal.
- Example: Look for the MACD on the 60m or 120m timeframe to turn bullish before committing to a longer-term position.
Scenario 2: Shorter Timeframes Bearish, Longer Timeframes Bullish
Interpretation
-
Shorter Timeframes (Bearish):
- Indicates short-term downward momentum.
- Possible reasons could include a pullback or profit-taking within a longer-term uptrend.
-
Longer Timeframes (Bullish):
- Suggests that the overall trend is upward.
- The market might be in a consolidation or retracement phase within a larger uptrend.
Trading Strategies
-
Buying the Dip:
- Entry: Use the bearish signals in shorter timeframes to identify pullbacks within the overall uptrend.
- Entry Point: Enter long positions when the shorter timeframes begin to align with the longer-term bullish trend again.
- Example: Wait for a bearish crossover on the 1m or 5m chart, then buy when the shorter timeframes show signs of reversing back to bullish.
-
Position Trading:
- Hold Existing Positions: If you are already in a long position based on the longer-term bullish trend, use the short-term bearish signals to manage risk but hold your position.
- Example: If the 60m or 120m timeframe is bullish, hold your long positions and use the 1m or 5m bearish signals to add to positions on dips.
-
Avoiding Short Trades:
- Avoid Shorting: Avoid initiating short positions against the longer-term bullish trend.
- Example: Despite bearish signals on the 1m or 5m chart, refrain from shorting as the overall trend (60m or 120m) is upward.
Practical Example of Mixed Signals
Let's assume the following table readings:
| Timeframe | 1m | 5m | 15m | 30m | 60m | 120m |
|---|---|---|---|---|---|---|
| MACD Line | 0.5 | 0.4 | 0.1 | -0.1 | -0.2 | -0.3 |
| Signal Line | 0.3 | 0.2 | 0.2 | 0.2 | 0.3 | 0.4 |
| Histogram | 0.2 | 0.2 | -0.1 | -0.3 | -0.5 | -0.7 |
| Gap | 0.2 | 0.2 | 0.1 | 0.3 | 0.5 | 0.7 |
| MACD Status | Bullish | Bullish | Bearish | Bearish | Bearish | Bearish |
| Zero Line Status | Above Zero | Above Zero | Below Zero | Below Zero | Below Zero | Below Zero |
Analysis
- Short-term (1m, 5m): Bullish signals with MACD lines above signal lines and above zero, indicating strong short-term momentum.
- Medium to Long-term (15m, 30m, 60m, 120m): Bearish signals with MACD lines below signal lines and below zero, indicating an overall downtrend.
Trading Approach
-
Scalping:
- Use the 1m and 5m bullish signals for quick, in-and-out trades.
-
Swing Trades:
- Enter on short-term bullish signals but be cautious and set tight stop-losses as the longer trend is bearish.
-
Wait for Reversal:
- Monitor for signs of reversal in longer timeframes before committing to long positions.
Conclusion
Mixed signals provide a nuanced view of market conditions, allowing traders to adapt their strategies based on the interplay between different timeframes. Understanding these dynamics helps in making informed decisions, whether for short-term gains or aligning with the longer-term trend.

