In-Depth Analysis of the MACD Gap: Understanding Its Significance in Trading
Detailed Analysis of the MACD Gap
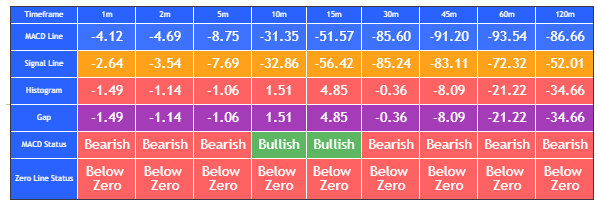
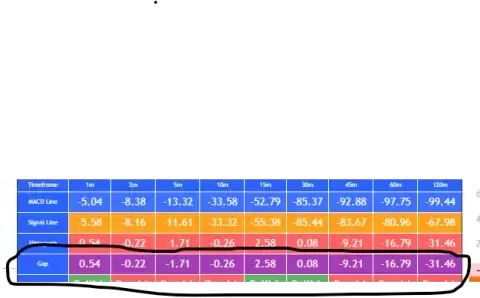
The "Gap" in the context of the MACD (Moving Average Convergence Divergence) indicator represents the absolute difference between the MACD line and the Signal line. This gap is a crucial component of the MACD analysis as it provides insights into the strength and momentum of the current trend. Let's explore its significance and how traders can use this information effectively.
What is the MACD Gap?
The MACD gap is calculated as follows: Gap=∣MACD Line−Signal Line∣\text{Gap} = |\text{MACD Line} - \text{Signal Line}|Gap=∣MACD Line−Signal Line∣
Here’s what each component signifies:
- MACD Line: This is the difference between the short-term and long-term exponential moving averages (EMAs). It reflects the market's current momentum.
- Signal Line: This is the EMA of the MACD line itself, smoothing out the MACD values to provide clearer signals.
Significance of the MACD Gap
-
Trend Strength Indicator:
- Large Gap: A large gap indicates strong momentum in the direction of the current trend. If the MACD line is significantly above the Signal line (large positive gap), it shows strong bullish momentum. Conversely, a large negative gap indicates strong bearish momentum.
- Example: If the gap between the MACD and Signal lines in the 1m and 5m timeframes is large, it suggests robust short-term momentum in that direction.
-
Trend Weakness and Potential Reversal:
- Narrowing Gap: When the gap starts to narrow, it signals that the current trend may be weakening. This can be an early indicator of a potential trend reversal. Traders should watch for the MACD line approaching the Signal line as a possible sign that momentum is fading.
- Example: If a previously large gap starts to decrease across multiple timeframes, it may indicate that the bullish or bearish trend is losing strength.
-
Overbought/Oversold Conditions:
- Extreme Gaps: While not a direct indicator of overbought or oversold conditions, an unusually large gap can suggest that the asset is stretched in one direction. This can often precede a correction or pullback.
- Example: An extremely large positive gap might suggest that the market is overbought, increasing the likelihood of a short-term correction.
-
Confirmation of Trend Continuation:
- Consistently Large Gap: A consistently large gap across multiple timeframes can confirm the continuation of the current trend. This reinforces the signals provided by other components of the MACD and overall technical analysis.
- Example: If the gap remains large and consistent across the 1m, 5m, and 15m timeframes, it confirms strong and sustained momentum.
Practical Application of Gap Analysis
To effectively use the gap in MACD analysis, traders should incorporate it into their broader technical strategy. Here’s how:
-
Momentum Trades:
- Entry: Look for large gaps to confirm strong momentum before entering a trade. For bullish trades, ensure the MACD line is significantly above the Signal line, and vice versa for bearish trades.
- Exit: Monitor the gap for signs of narrowing to anticipate potential exits. If the gap starts to close, consider tightening stop-losses or taking profits.
-
Trend Reversals:
- Early Warning: Use a narrowing gap as an early warning sign of a potential trend reversal. This can be especially useful in conjunction with other reversal indicators like support/resistance levels or candlestick patterns.
- Example: If you notice the gap decreasing across several timeframes, prepare for a possible reversal and adjust your positions accordingly.
-
Confirmation of Breakouts:
- Breakout Confirmation: During breakouts, a widening gap can confirm the strength of the breakout. Ensure that the gap increases as the price moves beyond key levels.
- Example: A breakout above resistance with a rapidly widening gap in the MACD can provide additional confidence in the trade.
-
Multi-Timeframe Analysis:
- Consistent Analysis: Analyze the gap across multiple timeframes to get a comprehensive view of the trend’s strength. Consistency in the gap’s size and direction across timeframes provides stronger confirmation.
- Example: If the gap is large in both the 5m and 30m timeframes, it indicates strong momentum that is likely to persist.
Conclusion
The MACD gap is a vital tool in understanding the strength and sustainability of market trends. By carefully analyzing the gap's size and changes over time, traders can gain insights into trend momentum, potential reversals, and overbought/oversold conditions. Incorporating gap analysis into a broader trading strategy enhances decision-making and helps in identifying high-probability trade setups.
By regularly monitoring the MACD gap alongside other indicators, traders can stay ahead of market movements and make more informed trading decisions, ultimately leading to better trading outcomes.

