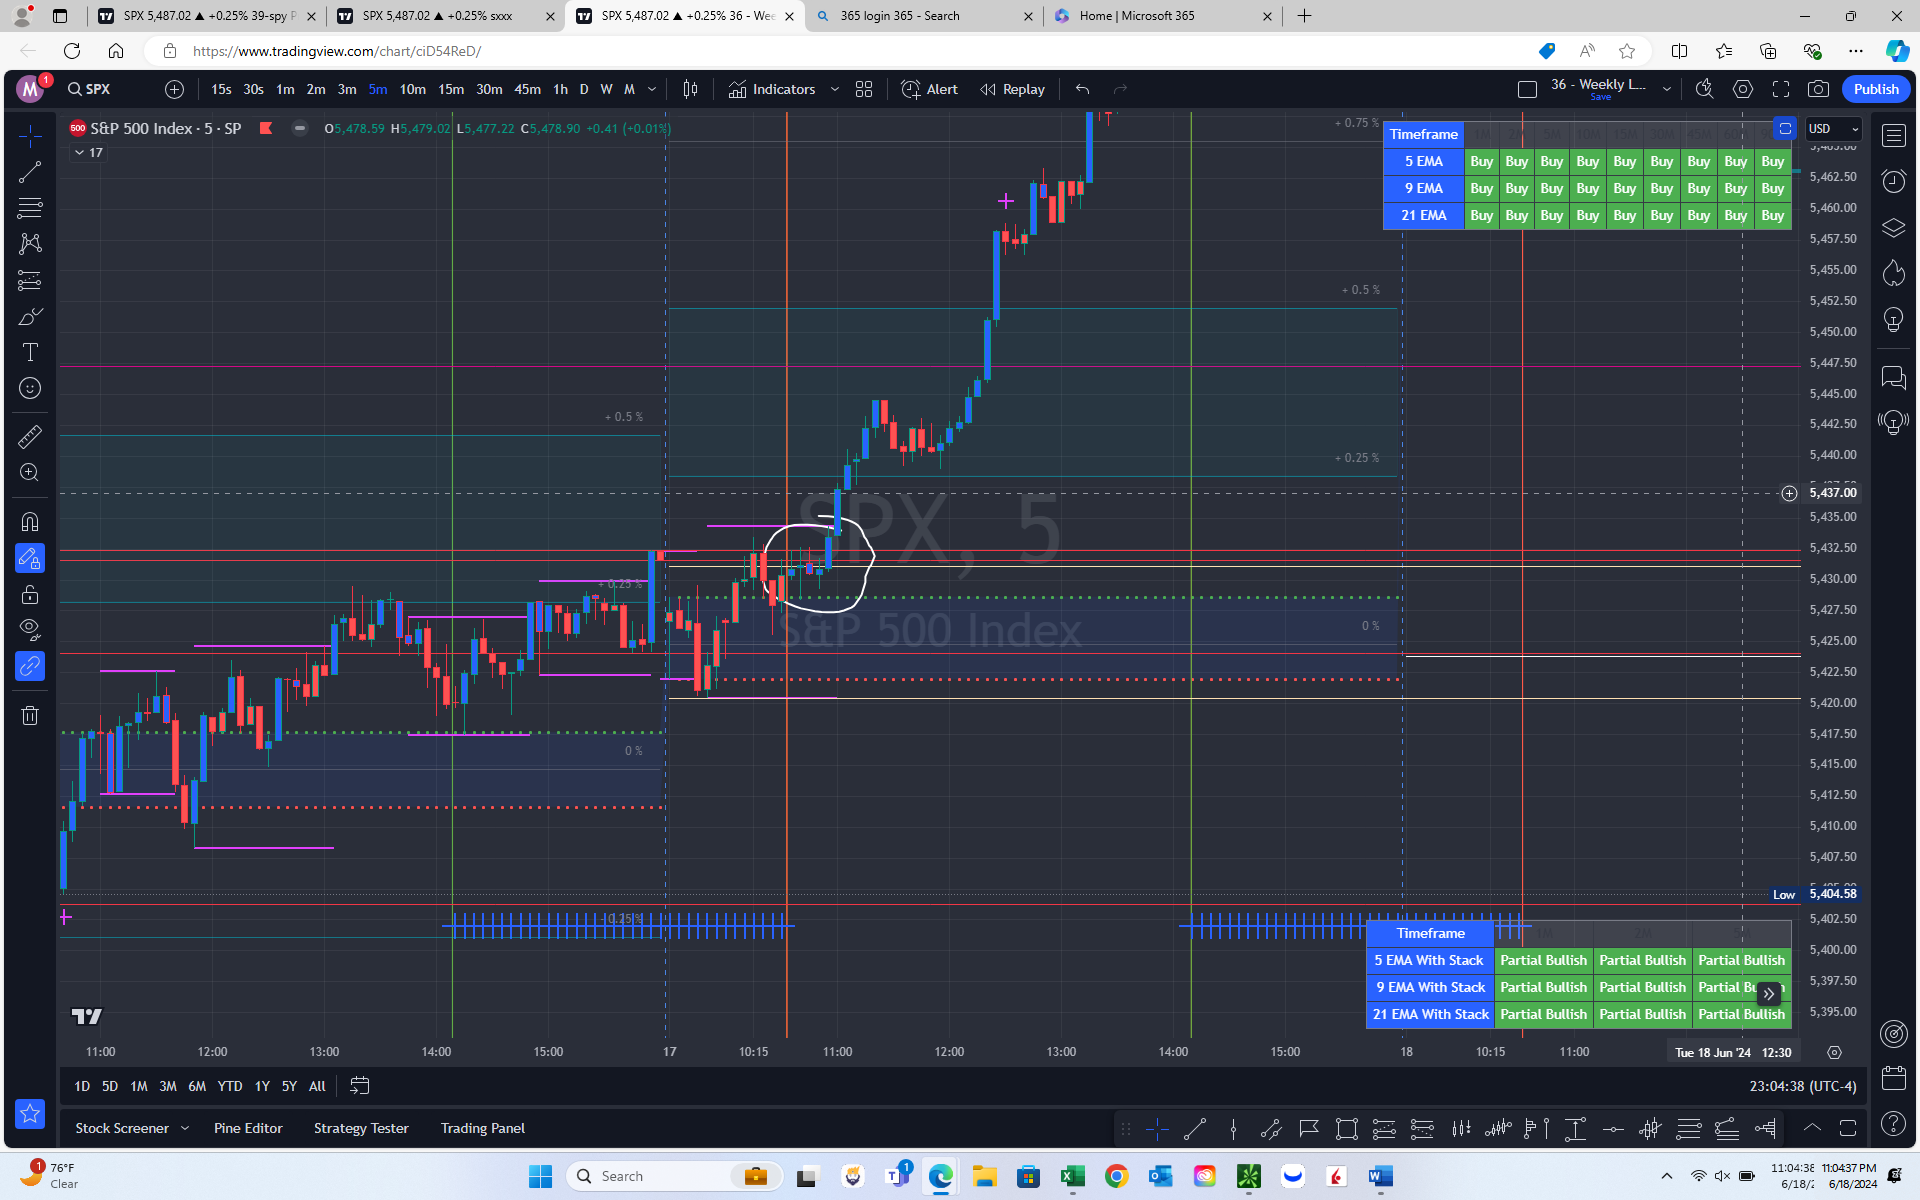
THADI: Intraday-Daily %, & Weekly OHLC Pro 1.1 -Key Features
Key Features
Premarket Levels:
- Displays premarket high and low levels to provide insights into overnight price movements.
Daily Levels:
- Shows the high, low, open, and close levels for the current day, previous day, and the previous three days for better intraday analysis.
Weekly Levels:
- Highlights the previous week's high, low, open, and close levels to understand weekly price trends.
Monthly Levels:
- Marks the previous month's high, low, open, and close levels for long-term trend analysis.
Moving Averages:
- Includes 8 EMA, 21 EMA, 50 SMA, 100 SMA, and 200 SMA to identify trends and potential support/resistance levels.
User-Defined Range Breakout (UDRB):
- Identifies the high and low of a user-defined time range at the market open, useful for breakout strategies.
First Hour Range:
- Tracks the high and low within the first hour of trading, providing key support and resistance levels early in the trading day.
Daily Percent Levels:
- Tracks the percentage changes relative to the day’s open throughout the trading day, highlighting key levels at 1% and fractional percent changes.
Consolidation Support and Resistance:
- Automatically displays consolidation support and resistance levels based on user settings to identify areas of market congestion.
Potential Reversion & Initial Profit Signal:
- Marked by a (+) on the candles to indicate potential reversion points and initial profit-taking signals.
Volume Oscillator:
- Shows periods of increased volume, with the default set to highlight periods with more than double the regular volume, indicating significant trading activity.
Candle Color Change:
- Changes the color of candles to indicate when they have higher than regular volume, making it easier to spot significant volume spikes.
Additional Features
Crossing Moving Averages Alerts:
- Provides alerts when the price crosses over or under key moving averages (8 EMA, 21 EMA, 50 SMA, 200 SMA), indicating potential trend changes.
ATR Zones:
- Displays Average True Range (ATR) zones around key levels, helping to visualize potential areas of support and resistance based on market volatility.
Feedback Form
