User Manual : THADI: RSI Relative Strength Index with Divergence Tracker
User Manual for "THADI: RSI Relative Strength Index with Divergence Tracker"
Introduction
The "THADI: RSI Relative Strength Index with Divergence Tracker" (THADI: RSI Div Tracker) is a comprehensive technical analysis tool designed to monitor the RSI (Relative Strength Index) and identify bullish and bearish divergences. This indicator helps traders spot potential market reversals and trends by analyzing the RSI and its moving averages across different settings.
Installation and Setup
Adding the Indicator:
- Open your trading platform (e.g., TradingView).
- Navigate to the "Indicators" section.
- Go to "Invite-Only Scripts."
- Apply the "THADI: RSI Div Tracker" to your chart.
Prerequisites:
- Ensure you have a TradingView account.
- Have a basic understanding of technical analysis.
Parameters and Inputs
- RSI Settings:
- RSI Length: Period for RSI calculation. Default: 14.
- Source: Data source for RSI calculation (e.g., close price). Default: close.
- Show Divergence: Option to display divergence signals. Default: true.
- MA Settings:
- MA Type: Type of moving average used for smoothing the RSI (SMA, Bollinger Bands, EMA, SMMA, WMA, VWMA). Default: SMA.
- MA Length: Period for the moving average. Default: 14.
- BB StdDev: Standard deviation for Bollinger Bands. Default: 2.0.
- Cross Settings:
- Show Bull and Bear Crosses: Option to display bullish and bearish crossover signals. Default: true.
Features and Functions
- RSI Calculation: Computes the RSI based on the specified length and source.
- Moving Averages: Provides various moving average types to smooth the RSI.
- Bollinger Bands: Option to display Bollinger Bands based on the RSI.
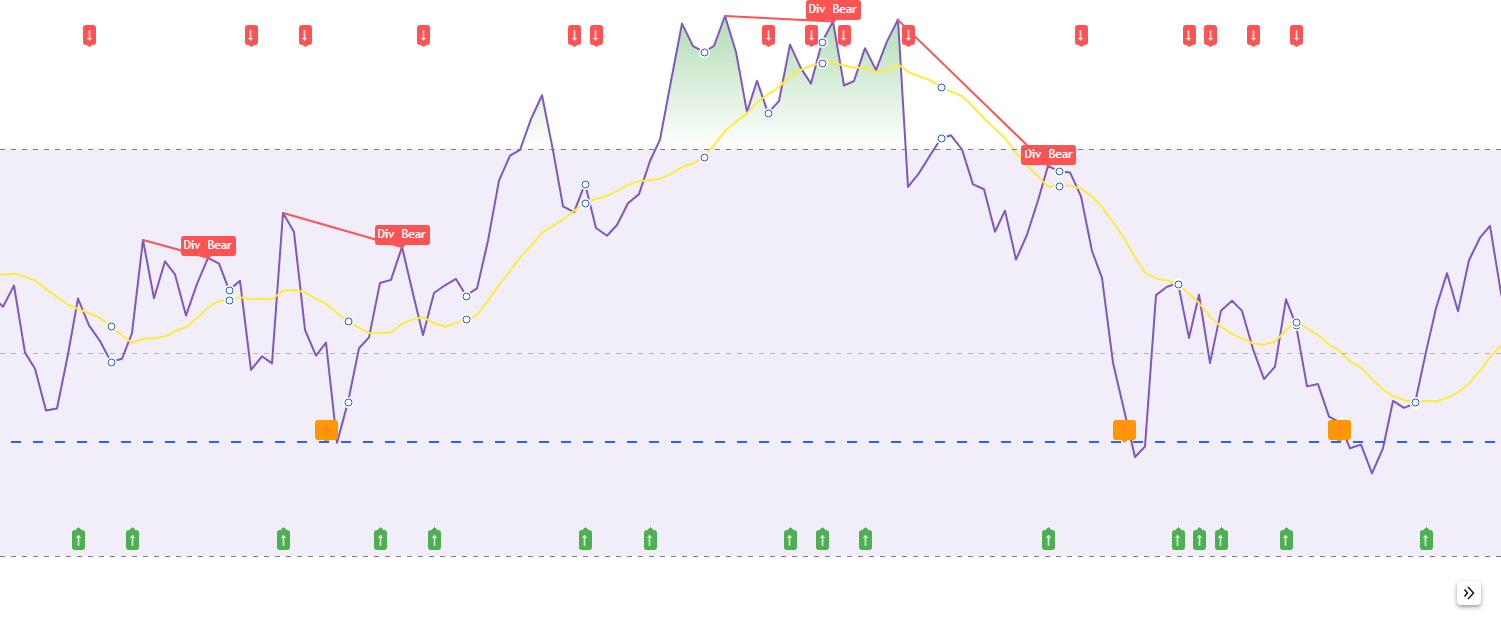
- Divergence Detection: Identifies bullish and bearish divergences between price and RSI.
- Crossover Signals: Indicates bullish and bearish crossovers between RSI and its moving average.
- Overbought and Oversold Labels: Marks overbought and oversold conditions with specific labels.
- Custom Alerts: Alerts for specific RSI crossovers, including a special alert at the 41.25 level.
Usage Instructions
Configuring the Indicator:
- Add the indicator to your chart.
- Adjust the parameters in the RSI Settings and MA Settings groups according to your trading strategy.
- Observe the RSI line, its moving average, and the divergence signals.
Interpreting the Indicator:
- RSI Levels:
- Overbought: RSI values above 70.
- Oversold: RSI values below 30.
- Midline: RSI at 50.
- Divergences:
- Bullish Divergence: When price makes a lower low and RSI makes a higher low, suggesting a potential upward reversal.
- Bearish Divergence: When price makes a higher high and RSI makes a lower high, indicating a potential downward reversal.
- Crossover Signals:
- Bullish Cross: When RSI crosses above its moving average, indicated by an upward arrow (↑).
- Bearish Cross: When RSI crosses below its moving average, indicated by a downward arrow (↓).
- Overbought and Oversold Conditions:
- Overbought Cross: When RSI crosses above 70, marked by a purple triangle up (↑).
- Exit Overbought: When RSI crosses below 70, marked by an orange triangle down (↓).
- Oversold Cross: When RSI crosses below 30, marked by a purple triangle down (↓).
- Exit Oversold: When RSI crosses above 30, marked by an orange triangle up (↑).
- Custom Alert at 41.25:
- A blue line at 41.25 with a special alert when RSI crosses this level downward, marked by an orange lightning bolt (⚡).
Example Scenarios:
- Trend Confirmation: Use RSI crossovers with its moving average to confirm trend direction.
- Divergence Signals: Look for divergences to spot potential market reversals.
- Custom Alerts: Pay attention to the special alert at 41.25 for significant market movements.
- Overbought and Oversold Conditions: Monitor the overbought and oversold labels for potential entry and exit points.
Advanced Settings and Customizations
- Adjusting RSI and MA Settings: Customize the length and type of moving averages to better fit the asset's behavior.
- Visual Customizations: Change the colors and styles of the RSI line, moving averages, and divergence labels to suit your preferences.
Troubleshooting
Common Issues:
- Indicator Not Displaying: Ensure the script is correctly added and there are no syntax errors.
- Signals Not Accurate: Verify that the input parameters are set appropriately for the asset and timeframe you are trading.
Solutions:
- Reload the Chart: Sometimes, a simple refresh can resolve display issues.
- Check for Updates: Ensure you have the latest version of the indicator.
FAQs
-
Can I adjust the RSI length and source? Yes, you can modify the RSI length and source in the RSI Settings group.
-
Can I change the type of moving average used? Yes, you can choose from various moving average types in the MA Settings group.
Best Practices and Tips
- Combine with Other Indicators: Use in conjunction with other technical indicators like MACD, EMA, or Bollinger Bands for more robust trading signals. For more indicators, visit Trading Hub Analytics Products.
- Risk Management: Always employ proper risk management strategies to mitigate potential losses.
Appendix
Glossary:
- RSI (Relative Strength Index): A momentum oscillator that measures the speed and change of price movements.
- EMA (Exponential Moving Average): A type of moving average that places a greater weight and significance on the most recent data points.
- SMA (Simple Moving Average): An arithmetic moving average calculated by adding the closing prices of a security for a number of time periods and then dividing this total by the number of time periods.
