Overview
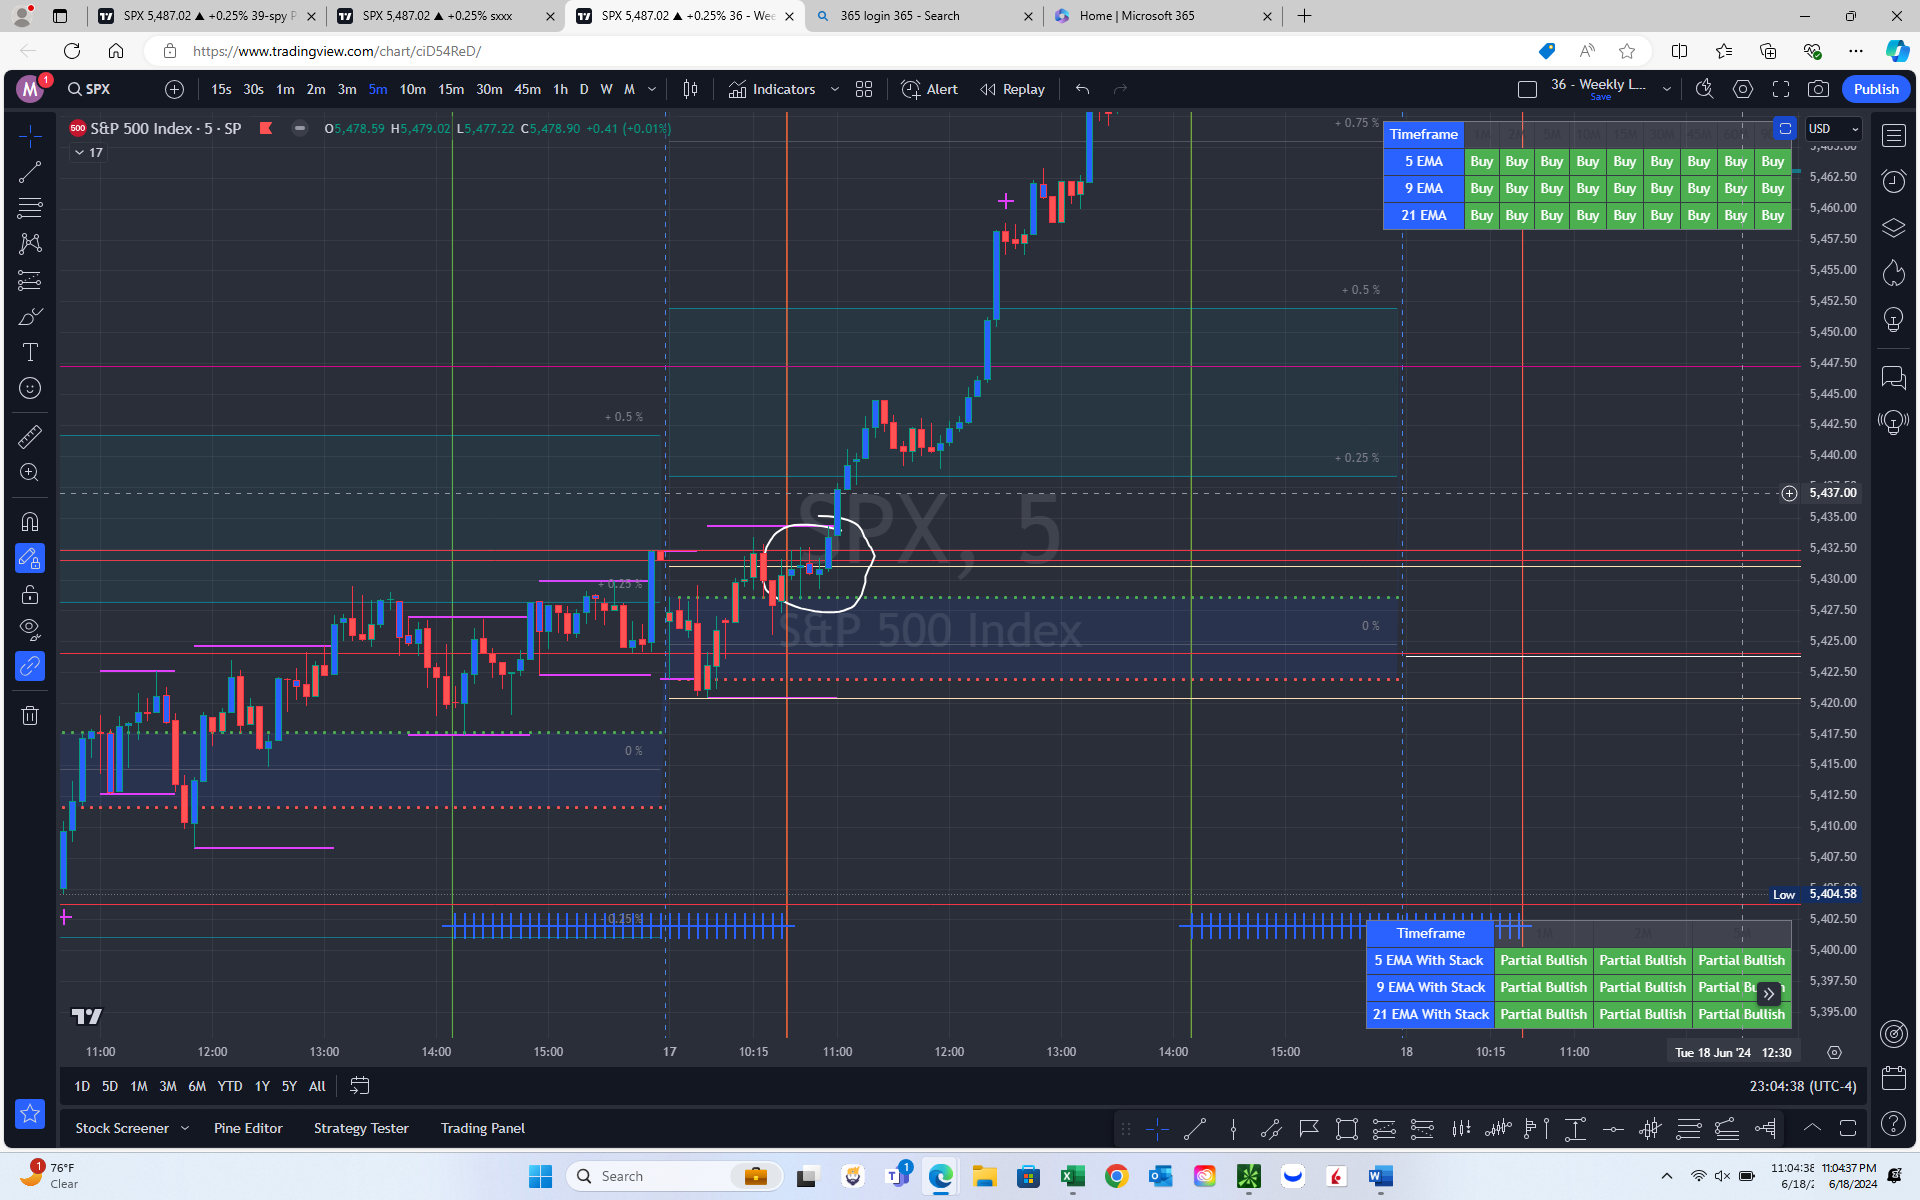
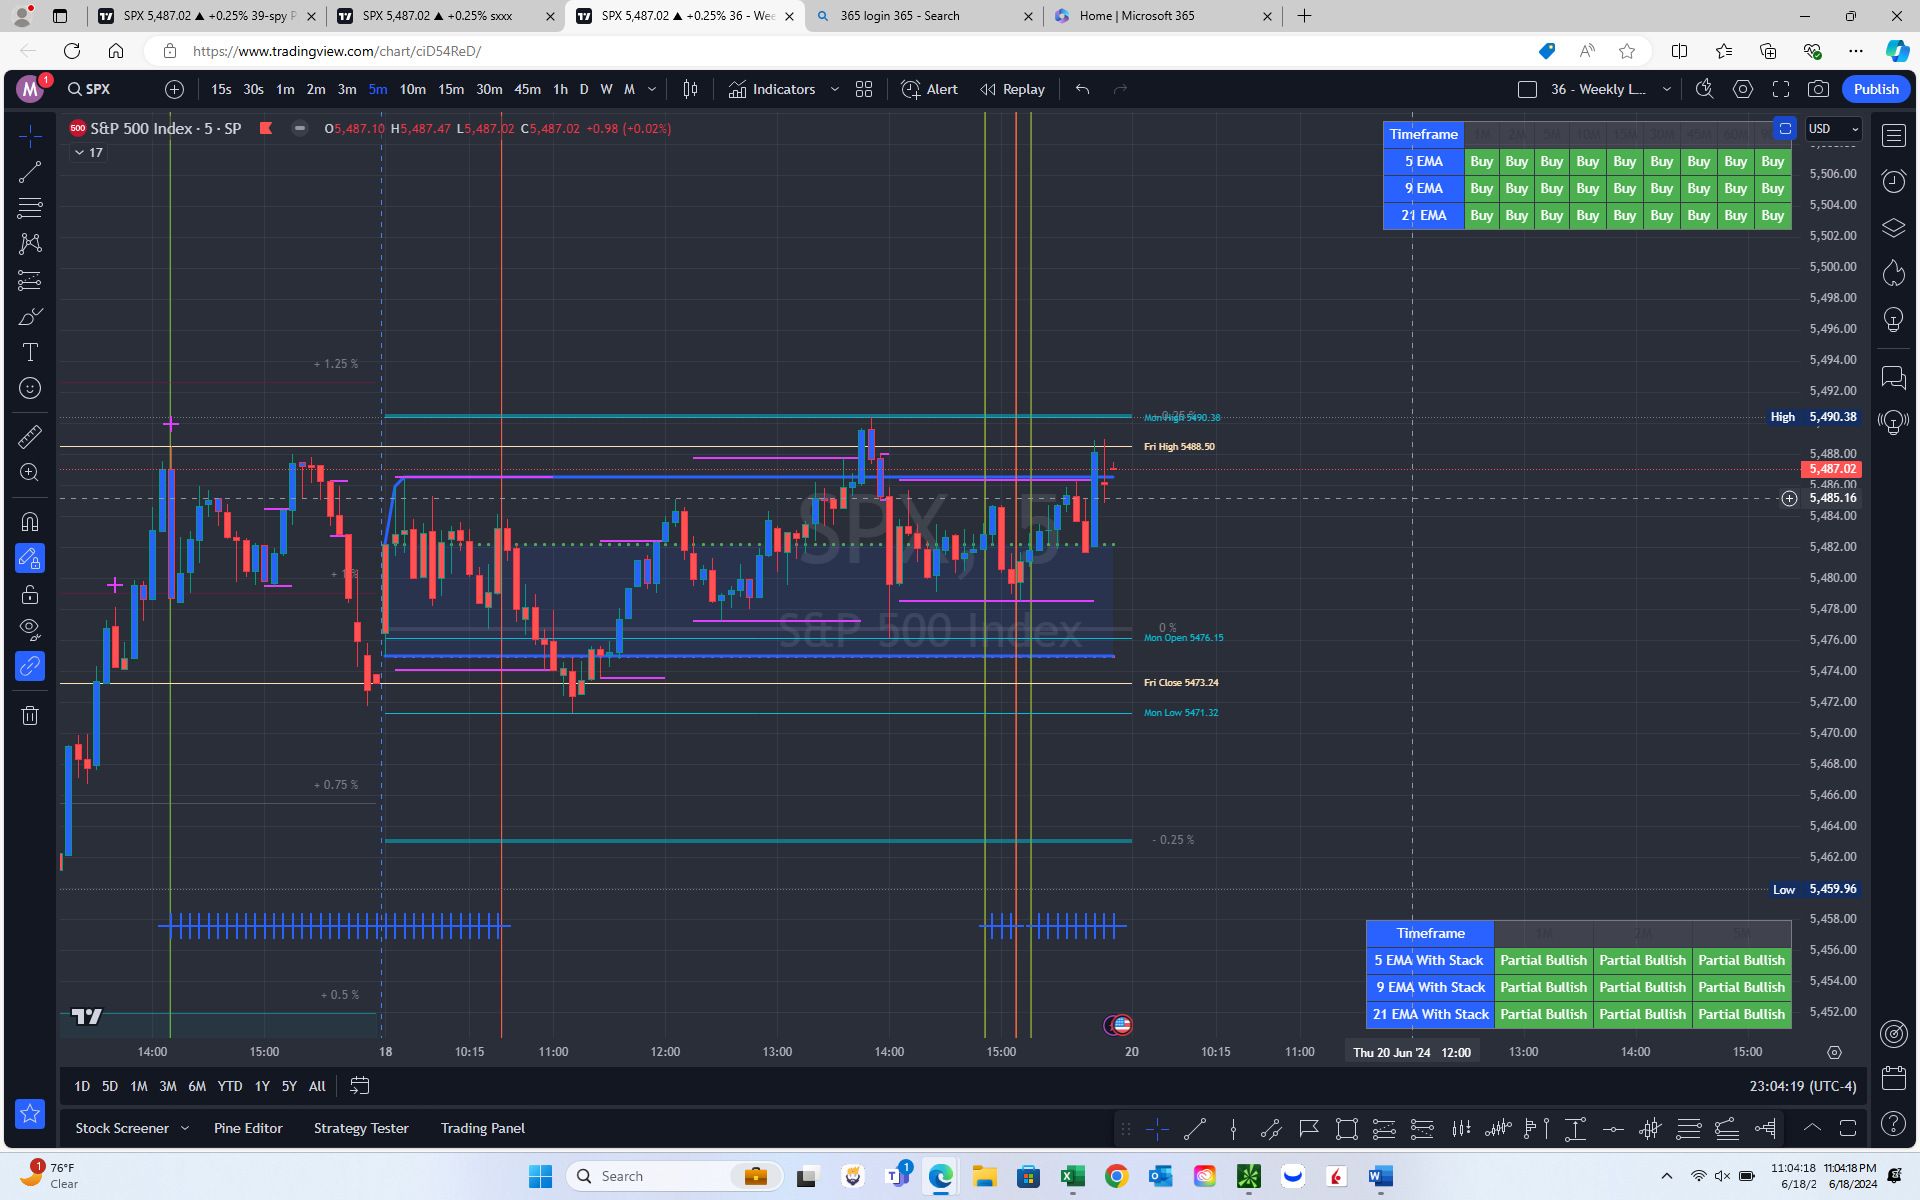
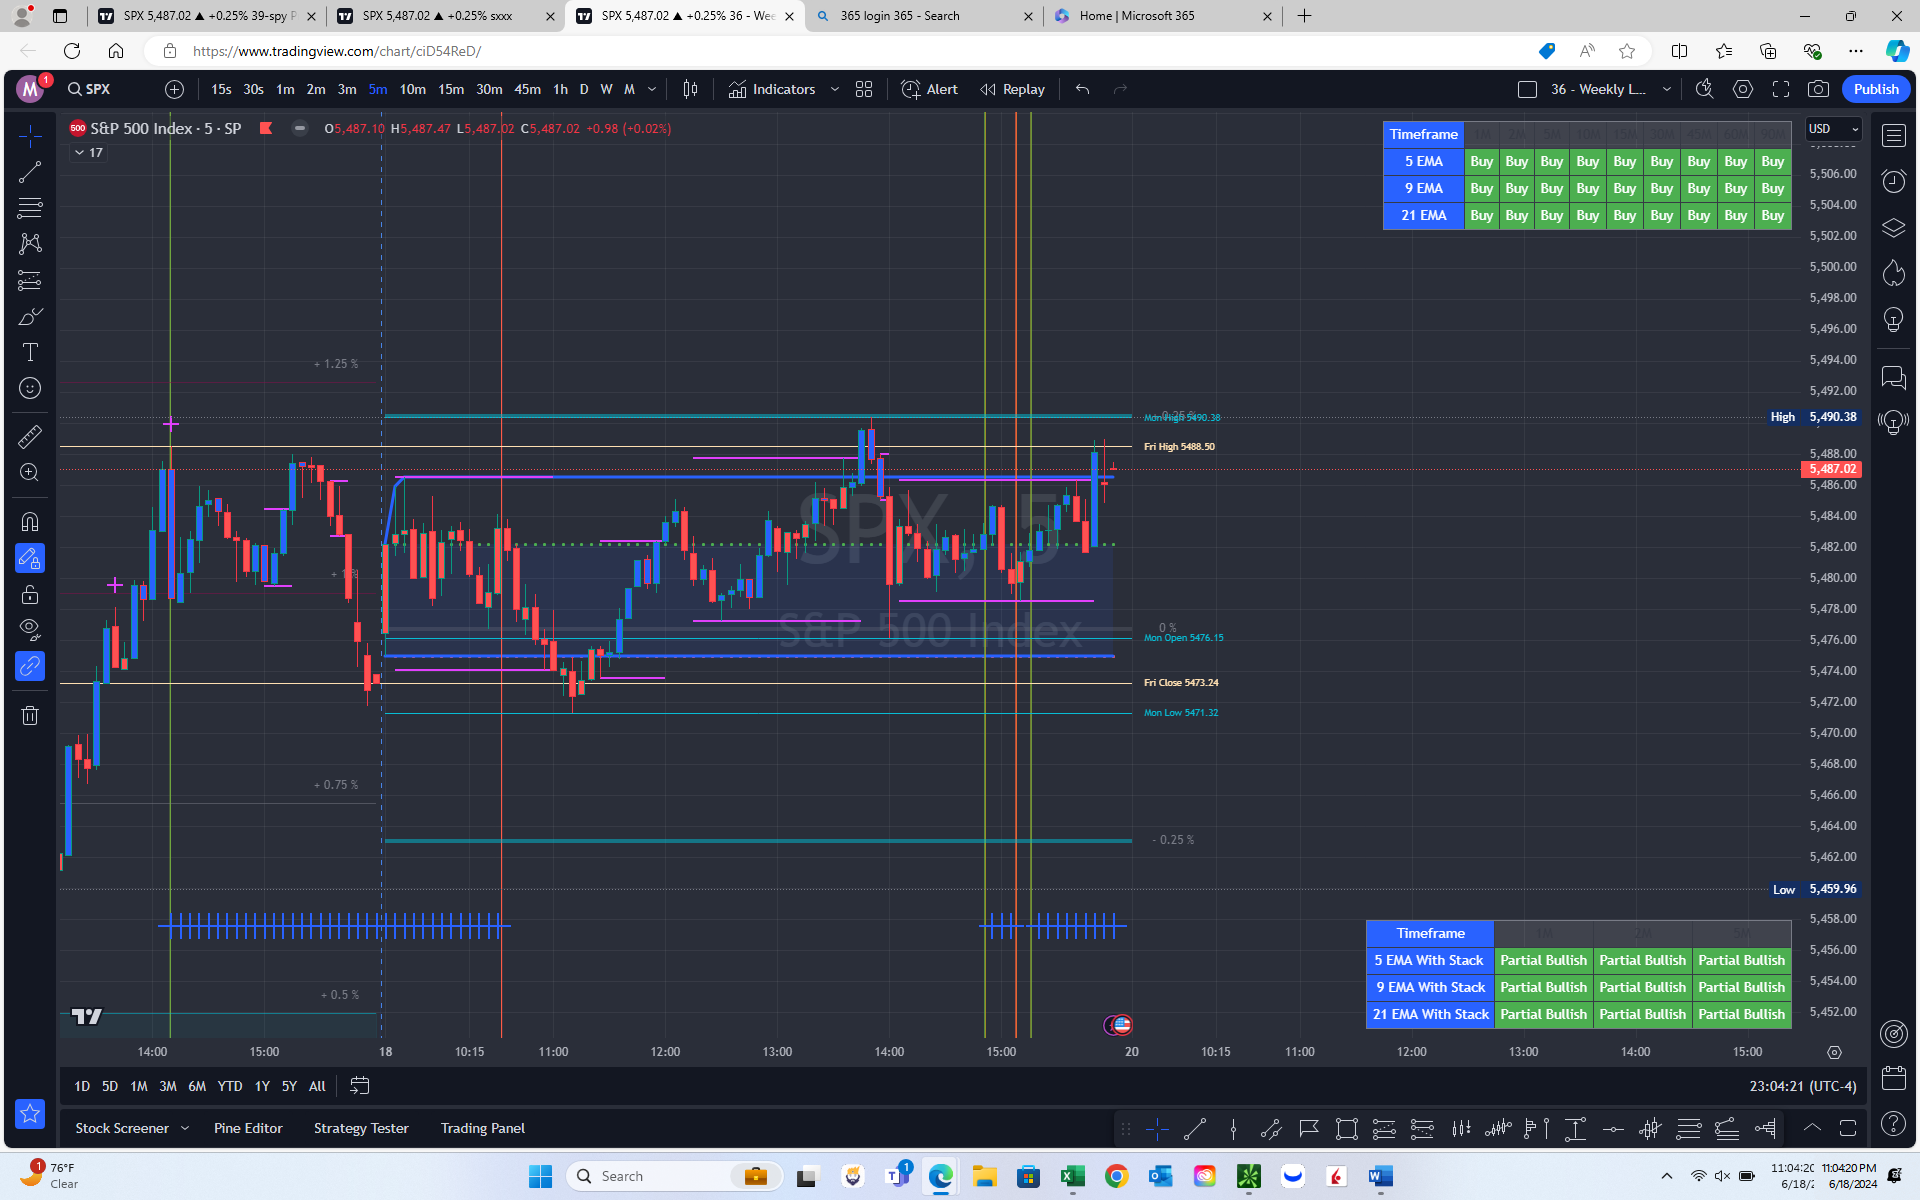
The "Trading Hub Analytics: Intraday-Daily %, & Weekly OHLC Levels Pro 1.1" indicator provides traders with key levels, such as daily high, low, open, close, and moving averages on their trading charts. This tool is designed to enhance your trading by providing clear visual references for important price levels.
Key Features
- Premarket Levels: Displays premarket high and low levels.
- Daily Levels: Shows the high, low, open, and close levels for the current, previous, and previous three days.
- Weekly Levels: Highlights the previous week's high, low, open, and close levels.
- Monthly Levels: Marks the previous month's high, low, open, and close levels.
- Moving Averages: Includes 8 EMA, 21 EMA, 50 SMA, 100 SMA, and 200 SMA.
- User-Defined Range Breakout (UDRB): Identifies the high and low of a user-defined time range at the market open.
- First Hour Range: Tracks the high and low within the first hour of trading.
- Consolidation support and Resistance: Automatically display Consolidation S & R per user settings
- Potential Reversion & Initial Profit Signal: Marked by (+) on the candles
- Volume Oscillator: Shows periods of increased volume, default more than double
- Candle Color change : To show candles than have more than regular volume
Adding the Indicator to Your Chart
- Access the Indicator: Add the indicator from your trading platform's library.
- Apply to Chart: Once added, the indicator will automatically start plotting key levels on your chart.
Customizing Settings
-
Global Settings:
- Line Width: Choose between Small, Medium, and Large.
- Line Style: Options include Solid, Dashed, and Dotted.
- Text Size: Options include Small, Medium, and Large.
- Label Position: Choose to place labels at the Top or Right of the price levels.
- Hide Prices: Option to hide price labels on levels.
- Global Coloring: Enable same color for all levels and set the global color.
-
Premarket Levels:
- Premarket High/Low: Enable or disable the display of premarket high and low levels.
- ShortHand: Use shorthand labels for premarket levels.
-
Daily Levels:
- Today Levels: Toggle the display of today's open, high, low, and close levels.
- Yesterday Levels: Toggle the display of yesterday's open, high, low, and close levels.
- Previous Days Levels: Enable levels for the previous three days.
- ShortHand: Use shorthand labels for daily levels.
-
Moving Average Levels:
- Toggle Moving Averages: Enable or disable the display of 8 EMA, 21 EMA, 50 SMA, 100 SMA, and 200 SMA.
- ShortHand: Use shorthand labels for moving average levels.
-
Weekly and Monthly Levels:
- Last Week Levels: Toggle the display of the last week's open, high, low, and close levels.
- Last Month Levels: Toggle the display of the last month's open, high, low, and close levels.
- ShortHand: Use shorthand labels for weekly and monthly levels.
-
Opening Range Breakout (ORB):
- Enable ORB: Turn on/off the opening range breakout levels.
- Session Time: Define the time range for the opening range breakout.
- Hide Label: Option to hide ORB labels.
-
Volume Oscillator:
- Enable Volume Oscillator: Plot the volume oscillator on the chart.
- Length: Set the length for the volume oscillator.
- Multiplier: Define the multiplier for the volume oscillator.
- Shapes: Toggle the display of volume oscillator cross shapes.
-
Reversion & Initial Profit Signal:
- Enable Signal: Display signals for candles opening far for potential reversion .
- Distance Threshold: Set the percentage distance threshold for signals.
- Lengths: Define the lengths for short and long Length for potential Reversion & Initial Profit Signal- Marked by (+) on the candles
-
Consolidation Range:
- ATR Length: Set the length for the Average True Range.
- Range Multiplier: Define the range multiplier for consolidation.
- EMA Lengths: Set lengths for short and long EMAs.
- Angle Threshold: Define the angle threshold for EMA proximity.
- Background Color: Enable/disable background color for consolidation range.
- Support & Resistance Thickness: Set the thickness of support and resistance lines.
Using the Indicator
- Visual References: Use the plotted levels to identify key support and resistance areas, potential breakout points, and overall market sentiment.
- Alerts: Take note of the alerts provided by the indicator, such as moving average crossovers.
- Custom Range and Intra Levels: Utilize custom range settings and intra levels for detailed analysis.
Notes
- This indicator is best used on intraday timeframes but can be adjusted for daily, weekly, and monthly analysis.
- Customize the settings according to your trading strategy and preferences.
- Use the visual cues provided by the indicator to make informed trading decisions.


