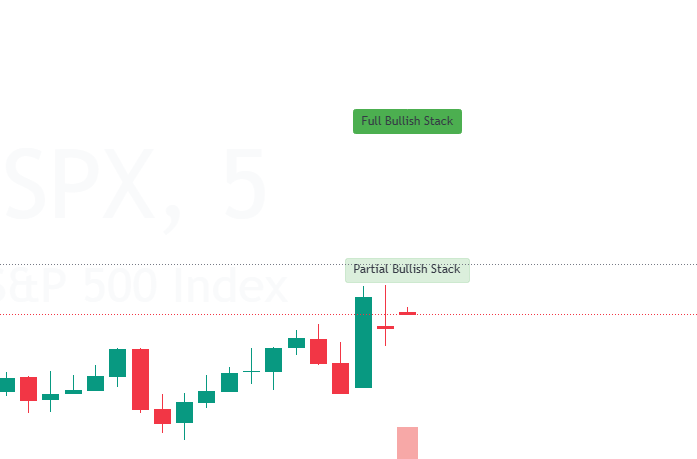
Trading Hub Analytics: Dynamics Stack Pro+ 1.1"
How to Use "Trading Hub Analytics: Dynamics Stack Pro+ 1.1" to Trade
The "Trading Hub Analytics: Dynamics Stack Pro+ 1.1" indicator provides visual cues to help you identify market trends through the alignment of multiple Exponential Moving Averages (EMAs). Here’s how you can use this tool to enhance your trading strategy:
1. Understanding the Labels
- Full Bullish Stack: Indicates a strong upward trend. EMAs are aligned with shorter periods above longer periods (e.g., EMA 9 > EMA 21 > EMA 50 > EMA 100 > EMA 200).
- Full Bearish Stack: Indicates a strong downward trend. EMAs are aligned with shorter periods below longer periods (e.g., EMA 9 < EMA 21 < EMA 50 < EMA 100 < EMA 200).
- Partial Bullish Stack: Indicates a potential upward trend. A shorter set of EMAs (e.g., EMA 5 > EMA 9 > EMA 13 > EMA 21) are aligned but not the longer periods.
- Partial Bearish Stack: Indicates a potential downward trend. A shorter set of EMAs (e.g., EMA 5 < EMA 9 < EMA 13 < EMA 21) are aligned but not the longer periods.
- Mixed: Indicates no clear trend. EMAs are not aligned in a clear bullish or bearish pattern.
2. Setting Up the Indicator
- Add to Chart: Apply the indicator to your trading chart in TradingView.
- Customize Settings: Adjust the EMA periods, elevation multiplier, and label offset to suit your trading preferences.
3. Trading Signals
- Enter Long (Buy) Position:
- When you see a "Full Bullish Stack" label, consider entering a long position, as it signals a strong upward trend.
- A "Partial Bullish Stack" label can also be an early indication to enter long but with caution.
- Enter Short (Sell) Position:
- When you see a "Full Bearish Stack" label, consider entering a short position, as it signals a strong downward trend.
- A "Partial Bearish Stack" label can also be an early indication to enter short but with caution.
- Avoid Trading in Mixed Signals:
- When the labels show "Mixed," it indicates uncertainty and lack of a clear trend, so it may be wise to avoid entering new positions.
4. Combining with Other Indicators
- Confirming Signals: Use other technical analysis tools (e.g., RSI, MACD, Volume) to confirm the signals given by the EMA stacks.
- Setting Stop-Loss and Take-Profit: Always set appropriate stop-loss and take-profit levels to manage risk, regardless of the signal strength.
5. Example Trading Strategy
- Entry: Enter a long position when a "Full Bullish Stack" appears, and the price closes above the highest EMA.
- Exit: Exit the position when a "Mixed" or "Full Bearish Stack" label appears, or the price falls below a key EMA (e.g., EMA 50).
- Risk Management: Set a stop-loss below a recent swing low for long positions or above a recent swing high for short positions.
By integrating the "Trading Hub Analytics: Dynamics Stack Pro+ 1.1" into your trading plan, you can better understand market trends and make informed decisions. Always backtest your strategy and use the indicator in conjunction with sound risk management practices.
