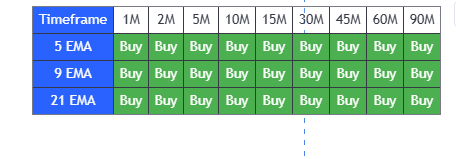
"THADI: Multi-Timeframe EMA Trend Dashboard Pro 1.0," calculates and tracks Exponential Moving Averages (EMAs) of lengths 5, 9, and 21 across multiple timeframes (1M, 2M, 5M, 10M, 15M, 30M, 45M, 60M, 90M). It displays buy and sell signals in a table format directly on the chart, providing a clear and concise overview of the current trend direction.
Key Features:
- Multi-Timeframe EMA Calculation: Tracks EMAs on 9 different timeframes to offer comprehensive trend analysis.
- Buy/Sell Signals: Indicates buy (green) and sell (red) signals based on the closing price relative to the EMAs.
- Customizable Table Position: Users can position the table in any of the four corners of the chart for optimal viewing.
This tool is ideal for traders looking to quickly assess market conditions and make informed trading decisions based on multi-timeframe EMA analysis.

