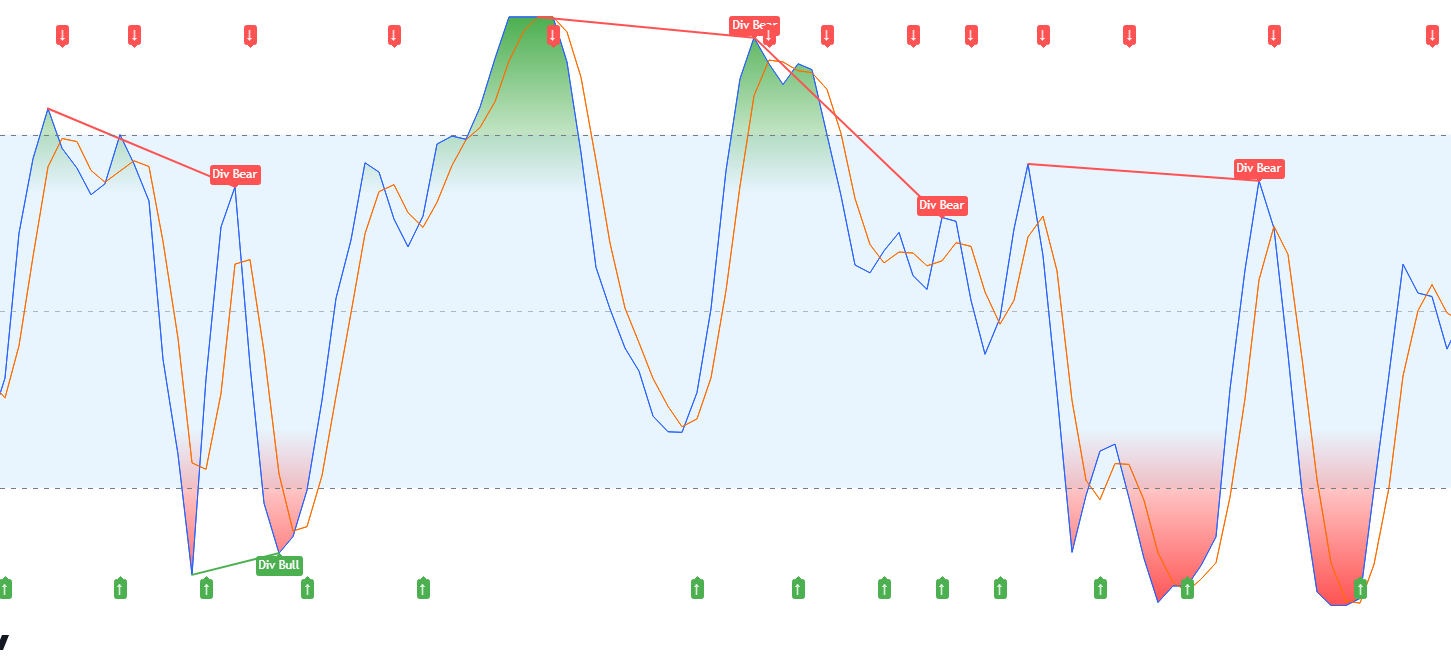
THADI: Lower Chart Stochastic RSI- User Manual
(THADI: Lower Chart Stoch RSI) is a custom technical indicator designed to enhance your trading strategies by providing insights into potential market reversals, overbought/oversold conditions, and trend divergences. This indicator is suitable for various markets, including SPX options trading, and can be applied to different timeframes to suit various trading styles.
Installation and Setup
Adding the Indicator:
- Open your trading platform (e.g., TradingView).
- Navigate to the "Indicators" section.
- Go to "Invite-Only Scripts."
- Apply the indicator to your chart.
Prerequisites:
- Ensure you have a TradingView account.
- Have a basic understanding of technical analysis.
Parameters and Inputs
- K: The smoothing factor for the Stochastic K line. Default: 3.
- D: The smoothing factor for the Stochastic D line. Default: 3.
- RSI Length: The period for the RSI calculation. Default: 14.
- Stochastic Length: The period for the Stochastic calculation. Default: 14.
- RSI Source: The data source for the RSI calculation (usually the closing price).
Features and Functions
- Stochastic RSI Calculation: Identifies potential overbought and oversold conditions.
- K and D Lines: Visualize momentum.
- Overbought and Oversold Bands: Visual indicators at the 80 (overbought) and 20 (oversold) levels.
- Shaded Areas: Highlight overbought and oversold zones.
- Divergence Detection: Identifies potential bullish and bearish divergences.
- Crossover Signals: Indicates bullish and bearish crossovers of %K and %D lines.
Usage Instructions
Configuring the Indicator:
- Add the indicator to your chart.
- Adjust the parameters (K, D, RSI Length, Stochastic Length) based on your trading strategy and timeframe.
- Observe the shaded areas to identify overbought and oversold conditions.
Interpreting the Indicator:
- Overbought/Oversold Conditions: When the shaded area is above 80, the market may be overbought. When it is below 20, it may be oversold.
- Divergences: Bullish divergence occurs when the price makes lower lows, but the indicator makes higher lows. Bearish divergence occurs when the price makes higher highs, but the indicator makes lower highs.
- Crossovers: A bullish signal occurs when the indicator crosses from below to above the middle line. A bearish signal occurs when it crosses from above to below the middle line.
Example Scenarios:
- Bullish Divergence: Consider entering a long position as it indicates potential upward momentum.
- Bearish Divergence: It may be an opportune moment to enter a short position.
- Overbought/Oversold: Use these signals to time your entries and exits, avoiding long positions in overbought conditions and short positions in oversold conditions.
Advanced Settings and Customizations
- Adjusting Sensitivity: Fine-tune the smoothing factors (K and D) and lengths (RSI and Stochastic) to match the volatility and behavior of different assets.
- Visual Customizations: Change the colors and styles of the lines and shaded areas to suit your visual preferences.
Troubleshooting
Common Issues:
- Indicator Not Displaying: Ensure the Pine Script code is correctly copied and there are no syntax errors.
- Signals Not Accurate: Verify that the input parameters are set appropriately for the asset and timeframe you are trading.
Solutions:
- Reload the Chart: Sometimes, a simple refresh can resolve display issues.
- Check for Updates: Ensure you have the latest version of the indicator.
FAQs
-
What is the optimal RSI length? The default length of 14 is commonly used, but you can experiment with shorter or longer periods based on market conditions.
-
Can I use this indicator for intraday trading? Yes, the indicator can be applied to various timeframes, including intraday charts.
Best Practices and Tips
- Combine with Other Indicators: Use in conjunction with other technical indicators for more robust trading signals. Consider combining with indicators such as moving averages, MACD, or Bollinger Bands. For more indicators, visit Trading Hub Analytics Products.
- Risk Management: Always employ proper risk management strategies to mitigate potential losses.
Appendix
Glossary:
- RSI (Relative Strength Index): A momentum oscillator that measures the speed and change of price movements.
- Stochastic Oscillator: A momentum indicator comparing a particular closing price to a range of its prices over a certain period.
